

BYK-Gardner GmbH, June 30, 2020
Ready for digitalization with BYK-Gardner’s new version of data analysis software smart-chart!
BYK-Gardner - worldwide partner of the automotive, paint and plastic industries for quality control of color, appearance and physical properties - is announcing an advanced version of their data analysis software smart-chart.
Global specifications and standardized QC procedures are the prerequisite for a seamless communication worldwide. BYK-Gardner’s new smart-chart software combines color and appearance data in one data analysis software and offers unsurpassed new functions to make you ready for efficient BIG DATA management.
Data Sharing for seamless communication
The measured data in smart-chart is saved in a SQL database which allows handling of large data sets over time. This reliable database type ensures full network and server compatibility. Data can be easily shared within the supply chain by extracting mini databases that can be sent by email and combined with other databases – see supplied parts before they even ship!
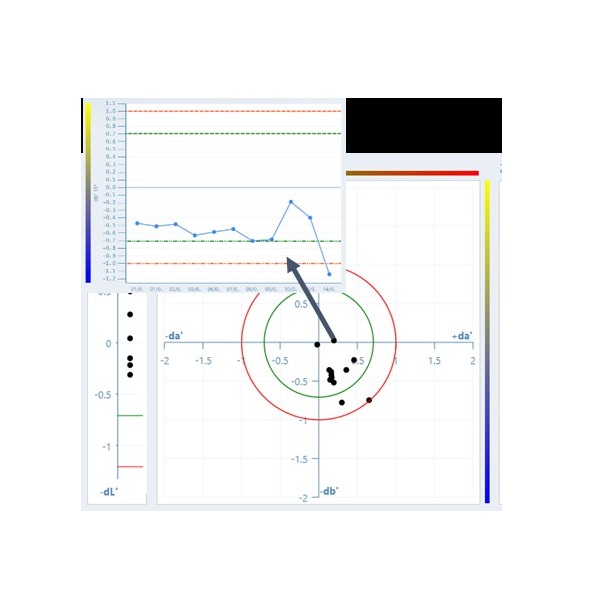
Brand new is the display of red and green tolerance lines. They are based on your product specifications in standard management and can easily indicate a quality drift so that you are able to proactively take measures to avoid costly rejects.
The new drill-in function shows history trend of the last 20 measurements of the same model, color and painting line. Just click on any point in the scatter plot!
Adapt the software to the needs of your co-workers
A new User Management allows definition of various user levels with different access rights. Complete modules can be deactivated and deletion and editing of standards and measurement data can be disabled. The user permission can be password protected to make sure everyone has only access to the assigned modules and functions.
Flexible data analysis in the laboratory with smart-lab
To manage your lab work the data can be saved in projects. For ease of operation multiple projects can be opened at the same time and an automatic saving and closing process can be defined – nearly error proofed!Samples can be organized into different groups e.g. all samples that are visually Pass – Fail – Borderline can be grouped together. For ease of visualization each group is displayed in one color in the graphs. An advanced sorting function based on all colorimetric values shown in the data table allows further analysis of measurement results.
smart-chart 7.1 – supports the new BYK-Gardner instruments wave-scan 3 and spectro2profiler
The new wave-scan 3 family for orange peel control comes with a fresh design to accommodate an extra-large color touch display. Operation and feel are as intuitive as you are used to with your smart-phone. For the first time the data can be displayed for Pass/Fail judgement in color. The new spectro2profiler is a game changer and marks a turning point in the analysis of structured surfaces. The combination of color, gloss, 3D topography and 2D reflectivity in one easy to use instrument is a milestone in the objective measurement control of textured surfaces.
If you are already a smart-chart user, the new software version can be downloaded free of charge from the SUPPORT section on the BYK-Gardner website: https://www.byk-instruments.com/software.
More information is available from BYK-Gardner GmbH, P.O. Box 970, 82534 Geretsried, Germany: By fax: +49-8171-3493-140, the free service no. 0-800-gardner (0-800-4273637) or on the internet at https://www.byk-instruments.com.
Other ALTANA divisions


A member of
