
spectro2profiler Color & Texture Color Meter & 3D Profilometer
spectro2profiler: Supports you through Ups and Downs to achieve Color and Grain Harmony
Color Measurement - as you see it
The spectro2profiler uses a circumferential illumination at 45° with 0° viewing.
The circumferential illumination is essential to achieve repeatable measurement results on textured surfaces.
The extra-large measurement spot with homogeneous illumination guarantees highly reliable and representative readings.

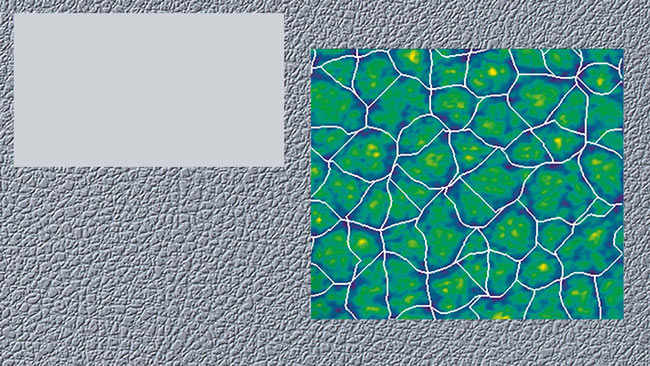
3D Surface Texture Analysis - as you see it
The spectro2profiler takes multiple images under different illumination directions to calculate and display 3D topography.
As a result you get objective measures for cell size (mm²) and perceived cell amplitude (P-µm).
Different grain types can be easily differentiated – ideal for design and new supplier approval.


Like our total visual judgement the new spectro2profiler measures color, gloss and the surface structure simultaneously in a robust, portable tool.
From Traditional Gloss Meter to 2D Reflectivity Measurement
The perceived depth of a leather-like surface is dependent on the reflection behavior on the hills and valleys.
The new spectro2profiler provides a 2D camera based reflectivity measurement which is aligned with the 3D image data to separate the reflection of hills and valleys.
The new measurement parameter Reflectivity Contrast Rc, is an ideal measure for production QC of injection or slush molded parts.
In order to compare historical data, the spectro2profiler also measures the 60° gloss according to international standards.

Color Measurement and 3D Profilometry with Outstanding Technical Performance
The spectro2profiler uses an innovative, high performance LED light source. Smart testing combined with our long-standing experience guarantees an outstanding performance.
Short-term, long-term and temperature stability as well as a homogeneous illumination spot are unsurpassed in the industry.
The long life time of our LEDs, guaranteed for 10 years, ensure low maintenance - no lamp replacement needed.


Superior inter-instrument agreement allows the use of digital standards – the key for global color and structure management.
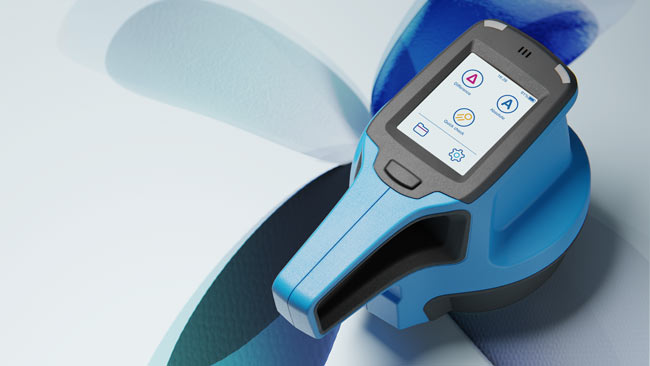
Color Touch Display
The spectro2profiler offers a 3.5’’ large color touchscreen for ease-of-use.
An icon-based menu with data tables and colorful graphs ensure an intuitive operation as you know it from your smartphone.
You can touch or swipe with your fingers – it even works when wearing gloves!

Live Preview for Precise Positioning
An integrated camera shows a live preview of the measurement spot. This prevents false readings on imperfections or scratches.
Tilting the instrument can be recognized by shadows on the image.
The four rubber pins on the bottom plate of the spectro2profiler ensure stable positioning on flat and curved samples – highest security guaranteed!


Structures can be objectively analyzed with different algorithms:
leather-like - coarse paint - fine textures
Color and 3D Topography Analysis with smart-chart
smart-chart includes a powerful standard management which allows defining Pass/Fail tolerances based on color, gloss and structure parameters.
Measurement results are simultaneously displayed in a data table and a variety of graphs highlighting the samples being out of specification.
The 2D/3D analysis is supported with color coded images to visualize the measurement data for ease of interpretation.

Other ALTANA divisions


A member of
